Macro economics
Quotes
Technical Analysis
Earnings calendar
Economic calendar
Holidays schedule
World Central Banks
Technical analysis
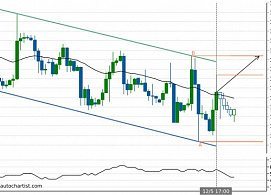
| 1.2661 | Channel Down |
| 1.2842 | Channel Down |
| Period | 3 days |
| Timeframe | 4 hour |
| Figure | Channel Down |
| Length | 61 Candles |
| Detected | 05 December 2018 |
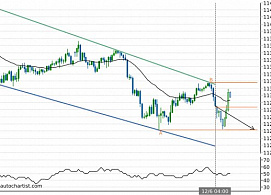
| 112.5935 | Channel Down |
| 113.2585 | Channel Down |
| Period | 2 days |
| Timeframe | 1 hour |
| Figure | Channel Down |
| Length | 115 Candles |
| Detected | 06 December 2018 |
Supported by Downward sloping Moving Average
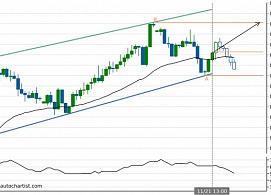
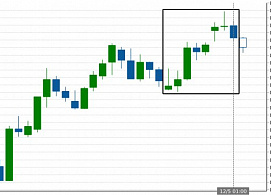
| 0.6783 | Channel Up |
| 0.6886 | Channel Up |
| Period | 3 days |
| Timeframe | 4 hours |
| Figure | Channel Up |
| Length | 59 Candles |
| Detected | 21 November 2018 |
Supported by Upward sloping Moving Average